Fil:Extrapolation example.svg
Hopp til navigering
Hopp til søk

Størrelse for denne PNG-forhåndsvisningen av denne SVG-filen: 600 × 480 piksler Andre oppløsninger: 300 × 240 piksler | 960 × 768 piksler | 1 280 × 1 024 piksler | 2 560 × 2 048 piksler.
Opprinnelig fil (SVG-fil, standardstørrelse 600 × 480 piksler, filstørrelse: 10 KB)
Beskrivelse
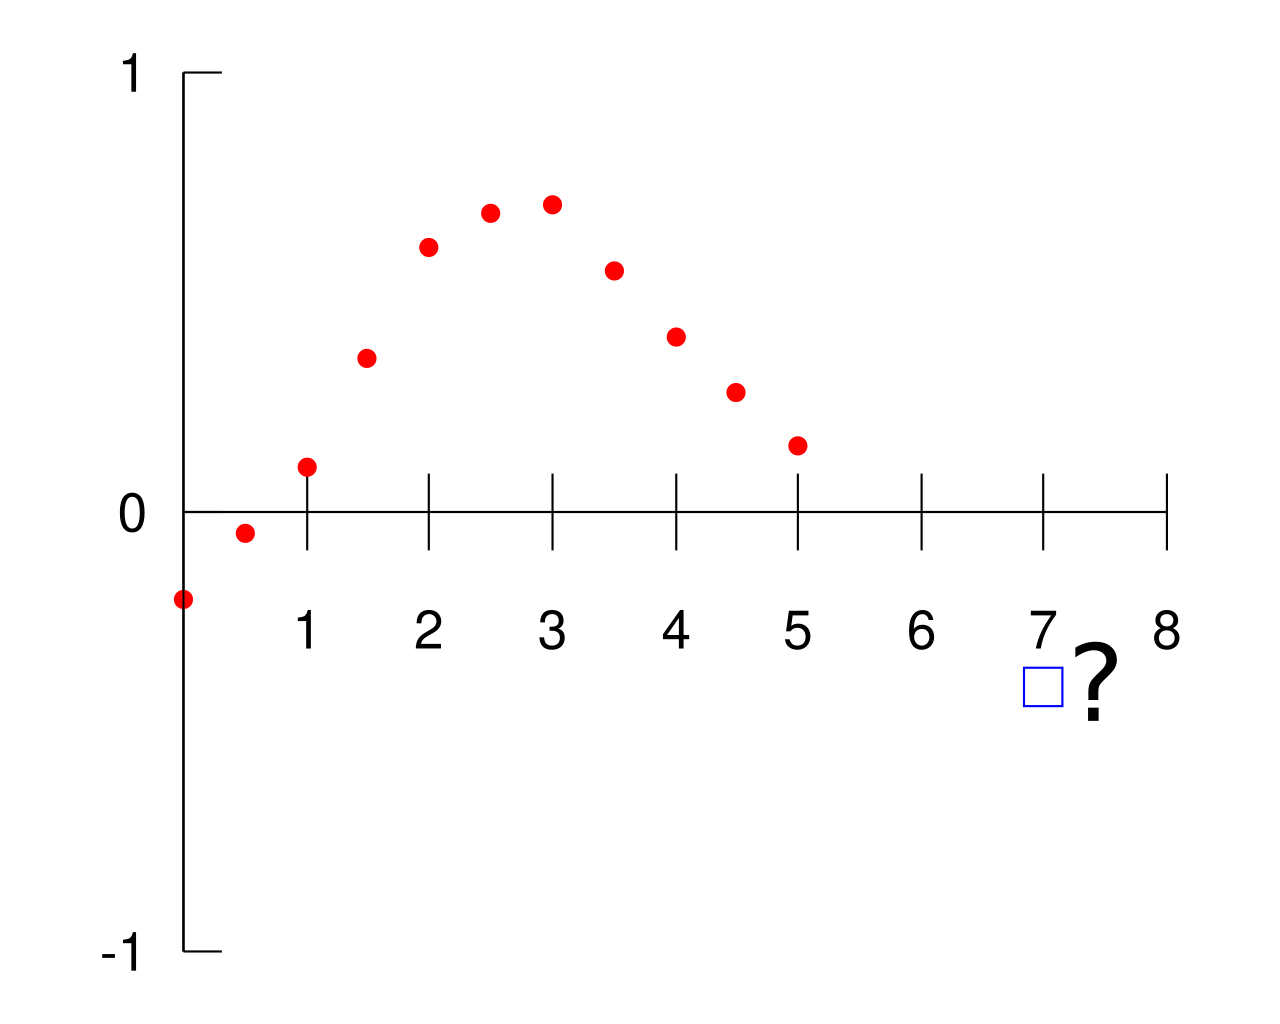
| Beskrivelse | Illustration of Extrapolation. The red points are assumed known and the extrapolation problem consists of giving a meaningful value to the blue box at . |
| Dato | |
| Kilde | self-made in Gnuplot. Question mark added in Inkscape. |
| Opphavsperson | Berland |

Gnuplot source code
set terminal svg fname "Helvetica" fsize 25
set output "Extrapolation_example.svg"
set key off
set xzeroaxis
set xtics axis 1,1
set ytics nomirror 1
set border 2
set xrange [0:8]
plot "-" with points pointtype 7 pointsize 0.5, 0 with lines -1,\
 "-" with points pointtype 4 pointsize 1
0 -0.2
0.5 -0.05
1 0.1
1.5 0.35
2 0.6
2.5 0.68
3 0.7
3.5 0.55
4 0.4
4.5 0.27
5 0.15
e
7 -0.4
e
Lisensiering
| Dette verket har blitt frigitt til allmennheten av opphavspersonen Berland. Dette gjelder på verdensbasis. I enkelte land kan dette være juridisk umulig. I så fall: Berland gir hvem som helst retten til å bruke dette verket for ethvert formål, uten noen vilkår, med mindre slike vilkår kreves ved lov. |
set terminal svg fname "Helvetica" fsize 25 set output "Extrapolation_example.svg" set key off set xzeroaxis set xtics axis 1,1 set ytics nomirror 1 set border 2 set xrange [0:8] plot "-" with points pointtype 0 pointsize 0.5, 0 with lines -1,\
"-" with points pointtype 4 pointsize 1
0 2.6680 0.5 2.6975 1 2.7272 1.5 2.7568
Filhistorikk
Klikk på et tidspunkt for å vise filen slik den var på det tidspunktet.
| Dato/klokkeslett | Miniatyrbilde | Dimensjoner | Bruker | Kommentar | |
|---|---|---|---|---|---|
| nåværende | 24. jun. 2007 kl. 16:34 | | 600 × 480 (10 KB) | wikimediacommons>Berland | {{Information |Description=Illustration of Extrapolation. The red points are assumed known and the extrapolation problem consists of giving a meaningful value to the blue box at <math>x=7</math>. |Source=self-made in Gnuplot. Questio |
Filbruk
Den følgende siden bruker denne filen: